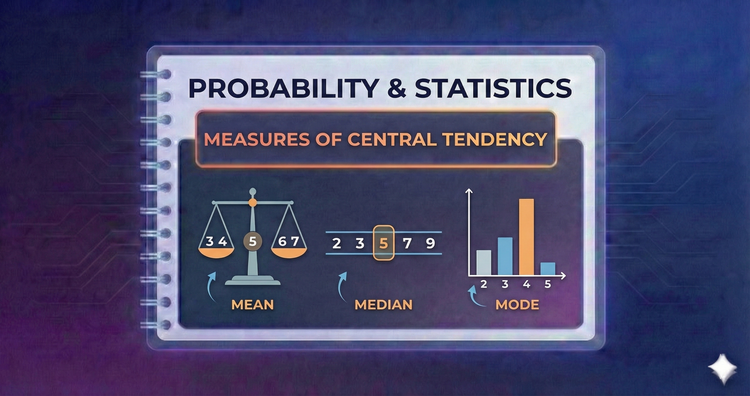
Probability & Statistics - Measures of Central Tendency
How do we define the "center" of data? We compare the Mean (arithmetic average), Median (middle value), and Mode (most frequent). We’ll see how outliers skew the mean and why the median often provides a better summary for skewed distributions.
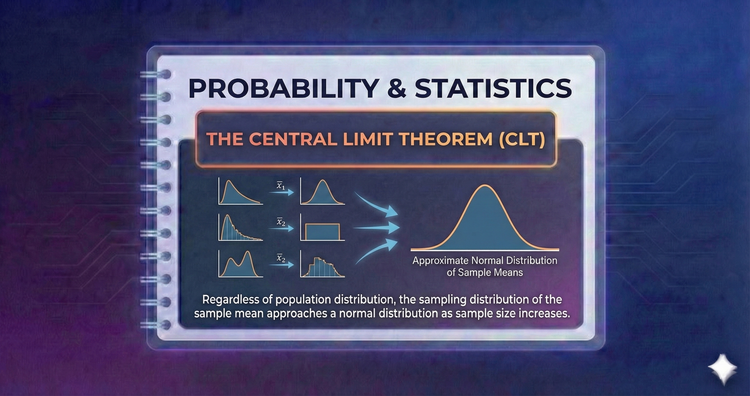
Probability & Statistics - The Central Limit Theorem (CLT)
The CLT states that the sum (or average) of independent random variables tends toward a Normal distribution, regardless of the original data's shape. This powerful theorem allows us to apply standard statistical methods to diverse real-world datasets.
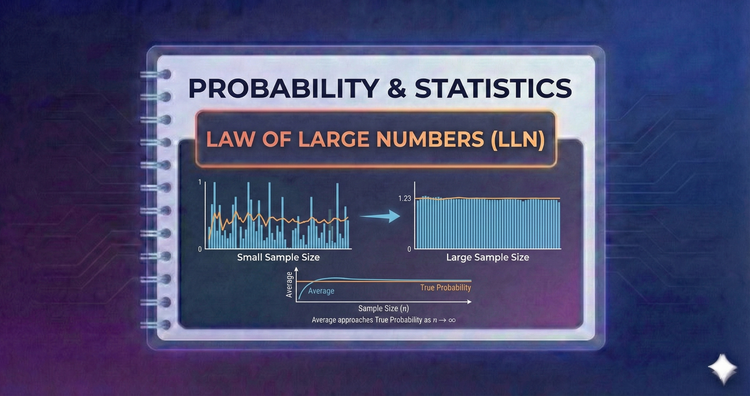
Probability & Statistics - Law of Large Numbers (LLN)
The LLN guarantees that as you collect more data, the sample average converges to the true population average. It provides the mathematical proof for why casinos always win in the long run and justifies using large datasets to estimate unknown parameters.
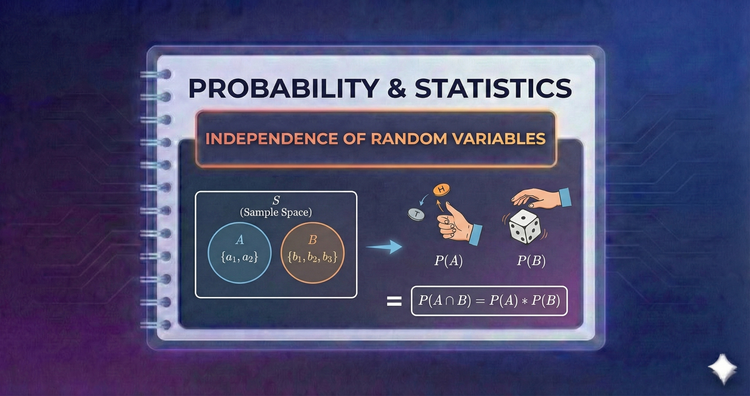
Probability & Statistics - Independence of Random Variables
Independence extends beyond events to variables. If knowing X tells you nothing about Y, they are independent. We define this formally using joint densities, allowing us to simplify complex models by treating components separately.
Probability & Statistics - Covariance and Correlation
How do variables move together? Covariance measures the direction of the relationship, while Correlation standardizes it between -1 and 1. We will learn to quantify the strength and direction of linear associations between random variables.
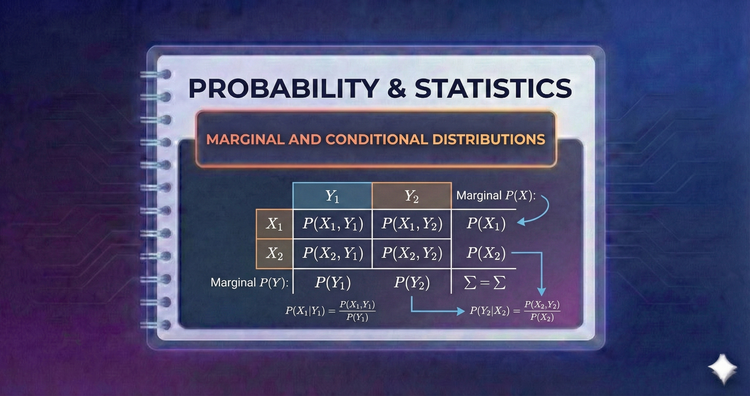
Probability & Statistics - Marginal and Conditional Distributions
From a joint distribution, we extract specific views. Marginals isolate one variable by "summing out" the others, while Conditionals update the probabilities of one variable given that another has taken a specific value.
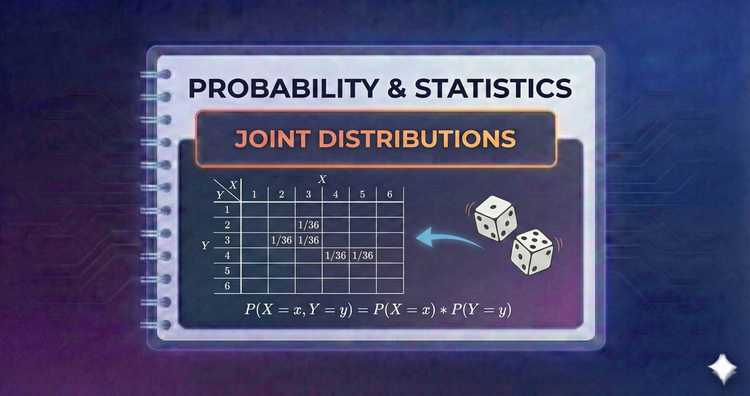
Probability & Statistics - Joint Distributions
Real-world problems involve multiple interacting variables. Joint distributions quantify the probability of two or more variables occurring simultaneously, creating the mathematical foundation for analyzing relationships and complex systems.
Probability & Statistics - Uniform and Beta Distributions
The Uniform distribution models "maximum uncertainty," where all intervals are equally likely. The Beta distribution is a flexible shape-shifter often used in Bayesian statistics to model uncertainty about probabilities or proportions themselves.
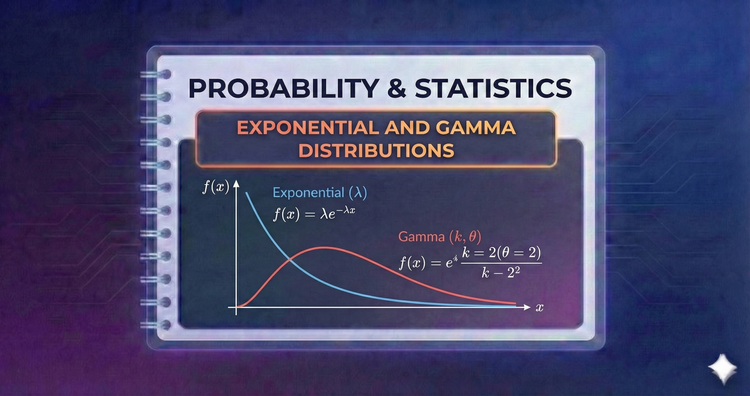
Probability & Statistics - Exponential and Gamma Distributions
The Exponential distribution models memoryless waiting times, like radioactive decay. The Gamma distribution generalizes this to the time required for multiple events to occur, making both essential for reliability engineering and queuing theory.
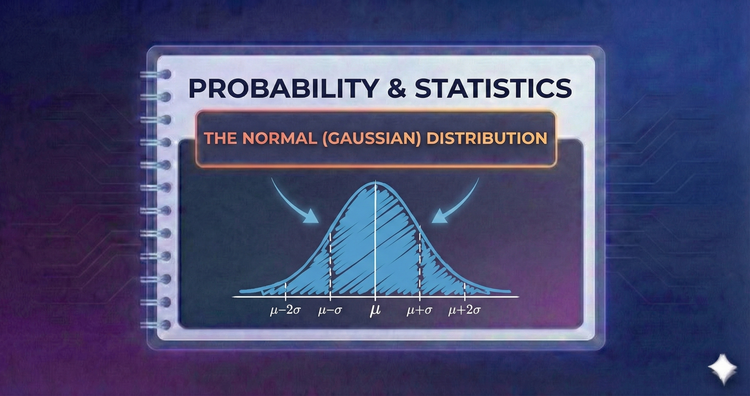
Probability & Statistics - The Normal (Gaussian) Distribution
The "Bell Curve" is the cornerstone of statistics. Defined by mean and variance, it appears naturally in error analysis and nature. We’ll master the Z-score and the 68-95-99.7 rule to estimate probabilities quickly and accurately.