Probability & Statistics - Interval Estimation
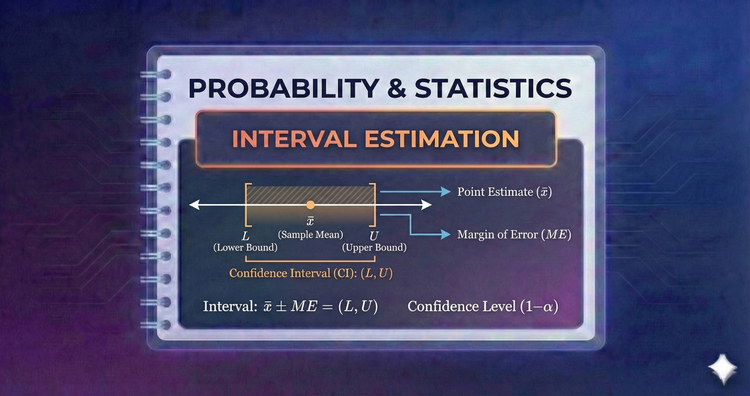
Point estimates (single numbers) miss the full picture. Interval estimation calculates a range of plausible values for a parameter. This approach quantifies uncertainty, providing a "margin of error" rather than a false sense of precision.
Probability & Statistics - Maximum Likelihood Estimation (MLE)
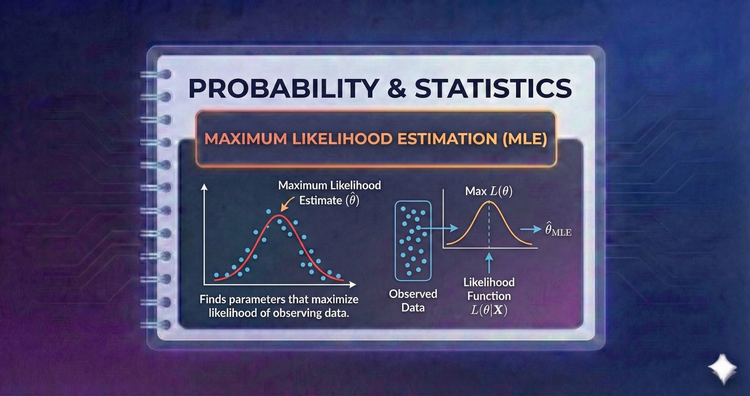
MLE asks: "Which parameters make our data most probable?" By maximizing the Likelihood Function, we derive estimators that are often the most accurate and precise, making MLE the gold standard for fitting models in modern statistics.
Probability & Statistics - Method of Moments
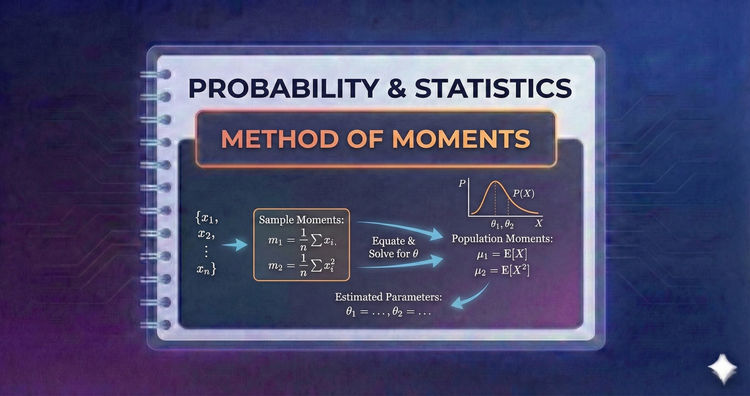
A classic estimation technique. We simply equate the sample statistics (like the mean) to the theoretical population moments and solve for the unknown parameters. It is an intuitive and computationally simple starting point for finding parameters.
Probability & Statistics - Properties of Estimators
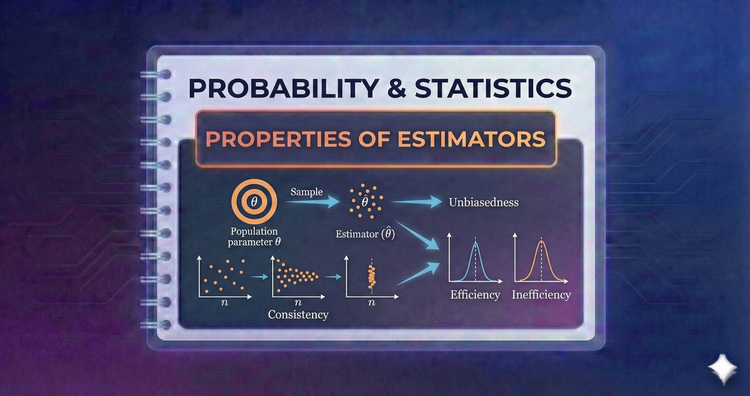
Not all guesses are equal. We judge estimators on Unbiasedness (is it right on average?), Consistency (does it improve with more data?), and Efficiency (lowest variance?). These criteria ensure our formulas produce reliable results.
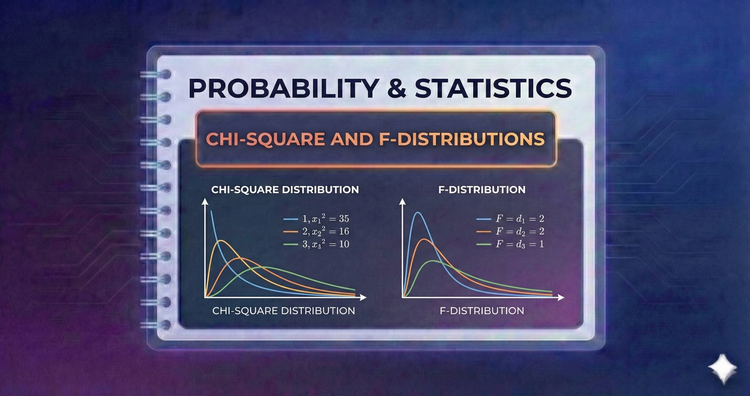
Probability & Statistics - Chi-Square and F-Distributions
The Chi-Square distribution arises from summing squared normal variables, essential for testing categorical fit. The F-distribution models the ratio of two variances, serving as the mathematical engine behind ANOVA and tests for equality of spread.
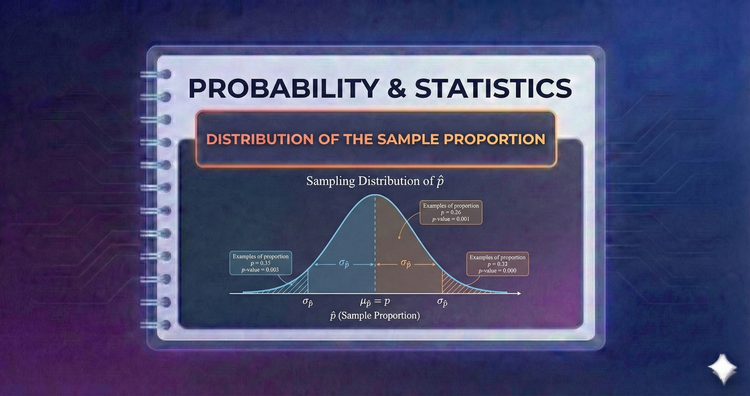
Probability & Statistics - Distribution of the Sample Proportion
When analyzing categorical data (like polling results), we look at the proportion of successes. We model how these sample proportions vary, allowing us to calculate probabilities and confidence intervals for survey data and binary outcomes.
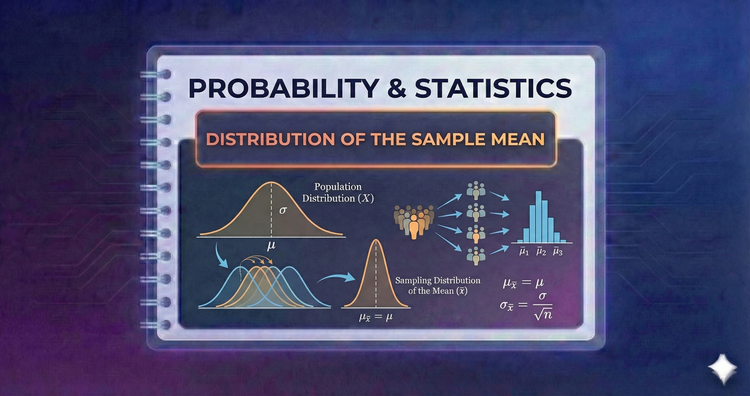
Probability & Statistics - Distribution of the Sample Mean
Even if the population is not Normal, the averages of samples drawn from it often are. We examine how the sample mean behaves, defining the Standard Error to measure how much our estimate is likely to fluctuate from the true population value.
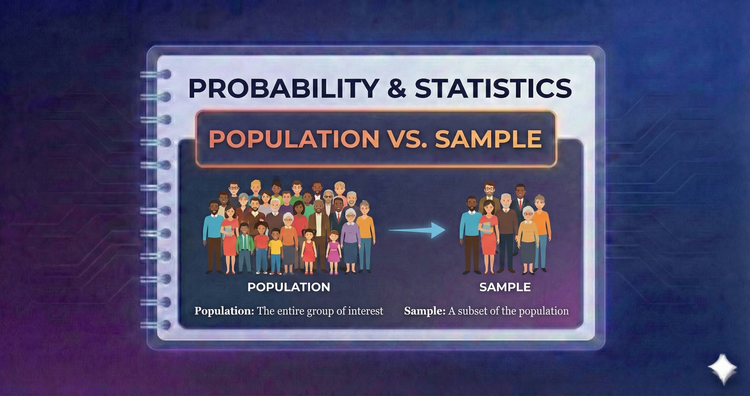
Probability & Statistics - Population vs. Sample
A Population is the entire group of interest, while a Sample is a subset used to estimate it. Distinguishing these is vital for inference, as we rarely have access to the full population.
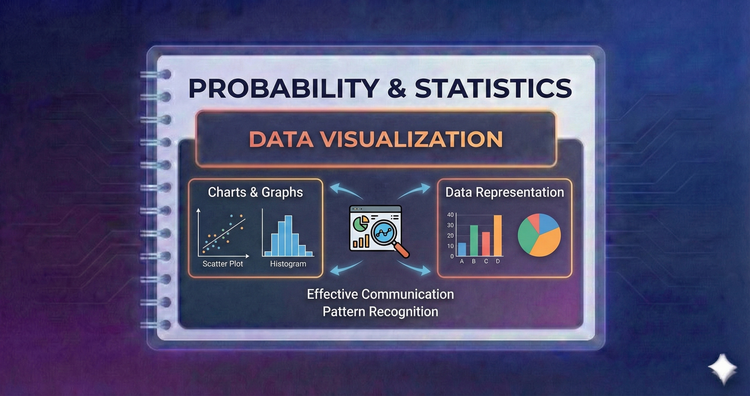
Probability & Statistics - Data Visualization
Visuals reveal patterns numbers miss. We’ll use Histograms to see distribution shapes, Box Plots to spot outliers, and Scatter Plots to identify relationships. Effective visualization is the first step in exploratory data analysis and communication.
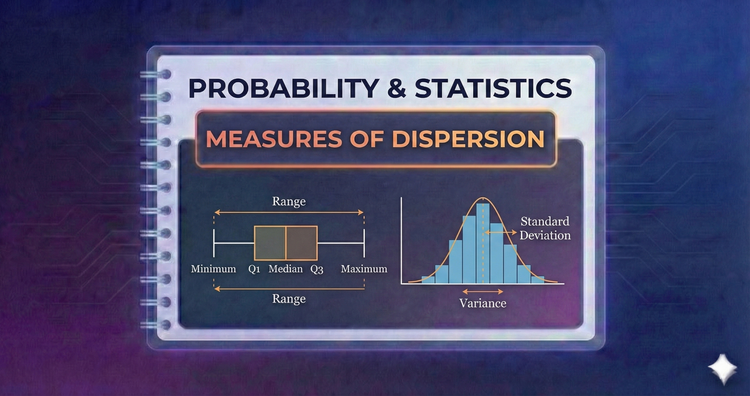
Probability & Statistics - Measures of Dispersion
Averages hide volatility. We use Variance and Standard Deviation to quantify how spread out data is from the mean. Along with Range and Interquartile Range (IQR), these metrics measure consistency, risk, and variability in any dataset.