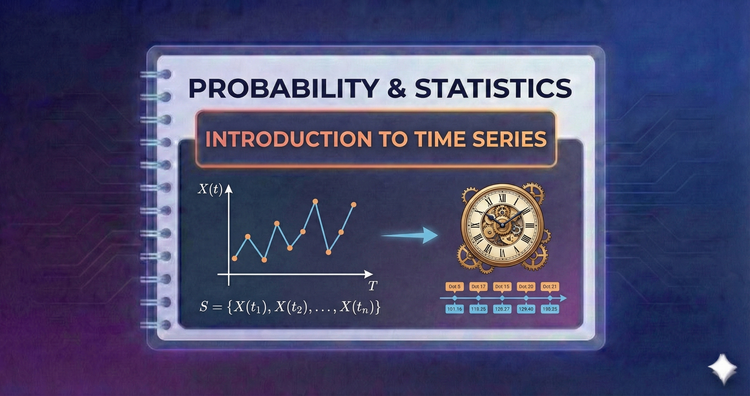
Probability & Statistics - Introduction to Time Series
Data often depends on when it happened. We explore temporal structure, autocorrelation (correlation with past values), and trends, moving beyond independent samples to model history and forecast future values.
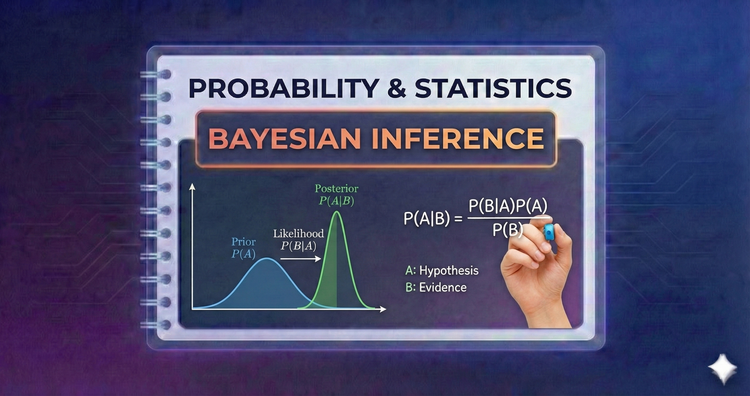
Probability & Statistics - Bayesian Inference
A shift in philosophy. Instead of fixed parameters, we treat them as random variables. We combine prior beliefs with observed data (likelihood) to calculate a "Posterior" probability, mathematically updating our view of the world.
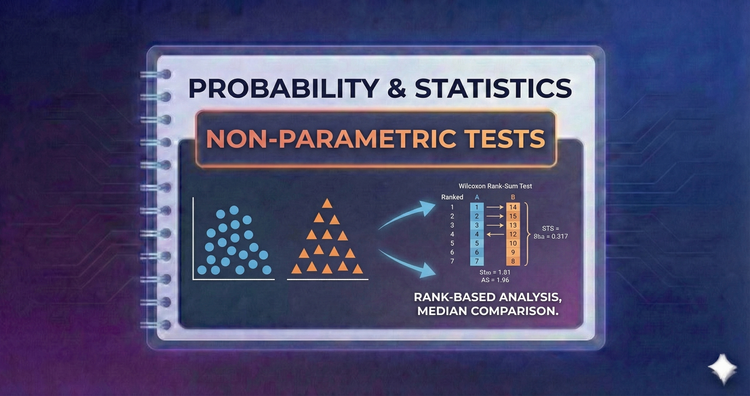
Probability & Statistics - Non-Parametric Tests
When data isn't Normal or sample sizes are tiny, standard tests fail. We use methods based on ranks (like Mann-Whitney or Kruskal-Wallis) to draw valid conclusions without assuming a specific distribution shape (Normality).
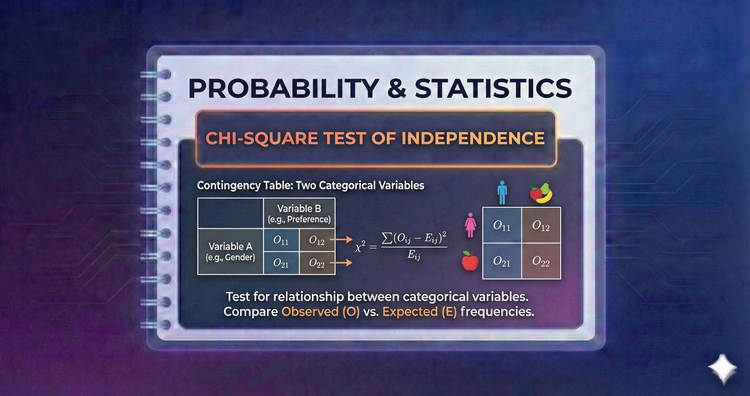
Probability & Statistics - Chi-Square Test of Independence
Are two categorical variables (like "Gender" and "Voting Preference") related? This test checks if knowing one variable helps predict the other. If the variables are independent, the observed pattern will match random chance.
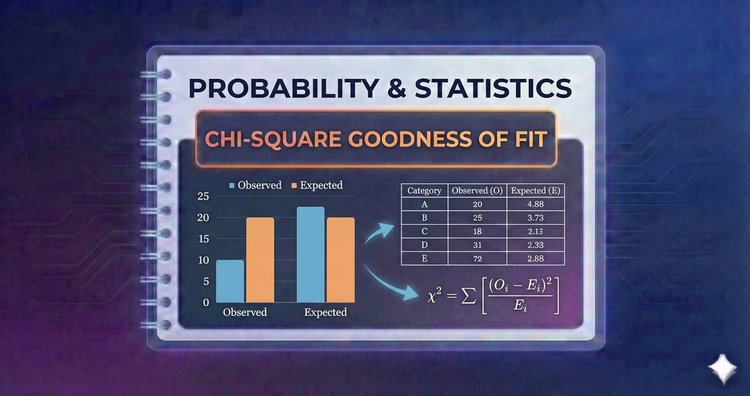
Probability & Statistics - Chi-Square Goodness of Fit
Does our data match expectations? This test compares observed counts to theoretical expected counts (e.g., "is this die fair?"). A large discrepancy suggests the data does not follow the hypothesized distribution.
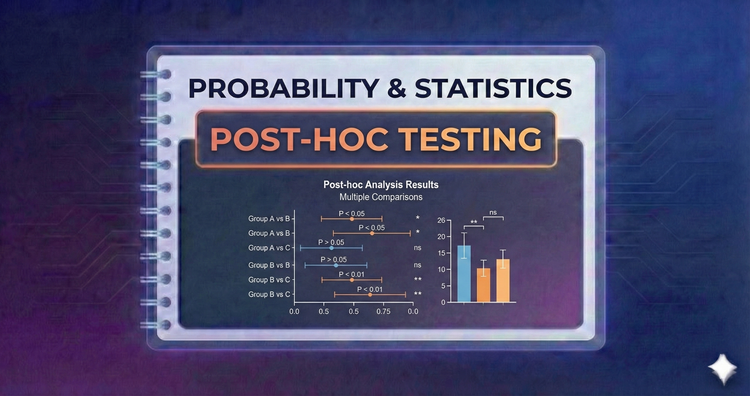
Probability & Statistics - Post-hoc Testing
ANOVA tells us "there is a difference," but not where. Post-hoc tests (like Tukey’s HSD) act as detectives after a significant ANOVA result, comparing specific pairs of groups while correcting for false positives to identify the exact outlier.
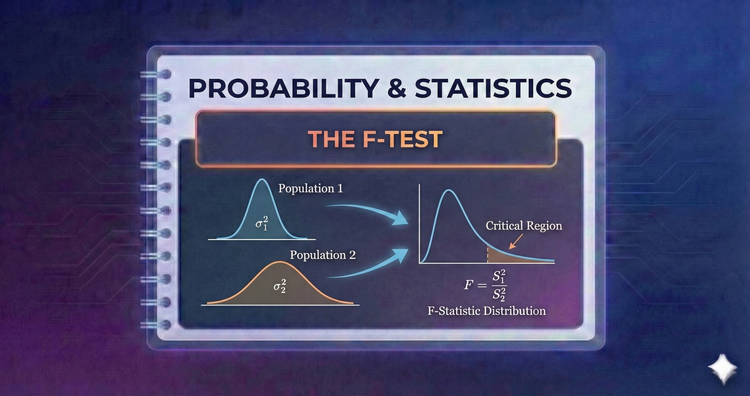
Probability & Statistics - The F-Test
The engine of ANOVA. It compares the "signal" (variance between group means) to the "noise" (variance within groups). A high F-ratio suggests the differences between groups are real, rather than just random fluctuations.
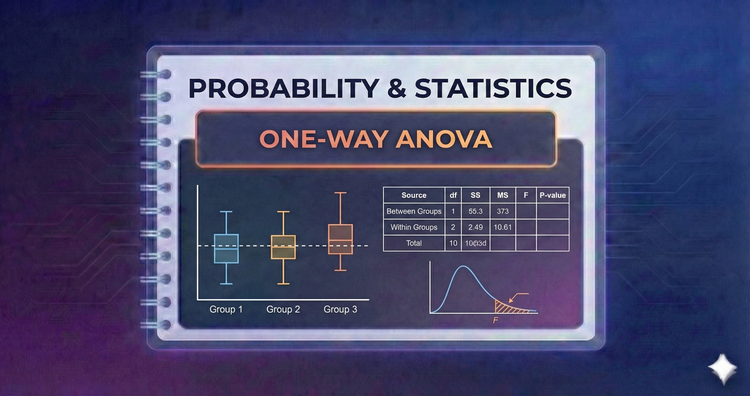
Probability & Statistics - One-Way ANOVA
Comparing two means is easy, but what about three or more? ANOVA tests if any group mean differs from the others by analyzing variance. It avoids the statistical errors that occur when running multiple separate t-tests.
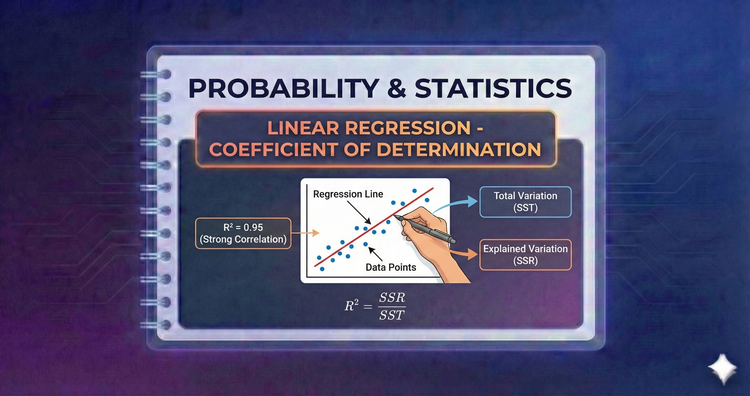
Probability & Statistics - Linear Regression - Coefficient of Determination
How well does the line fit? R square measures the percentage of variance in the dependent variable that is explained by our model. An R square of 1.0 indicates a perfect fit, while 0.0 means the model explains no variability at all.
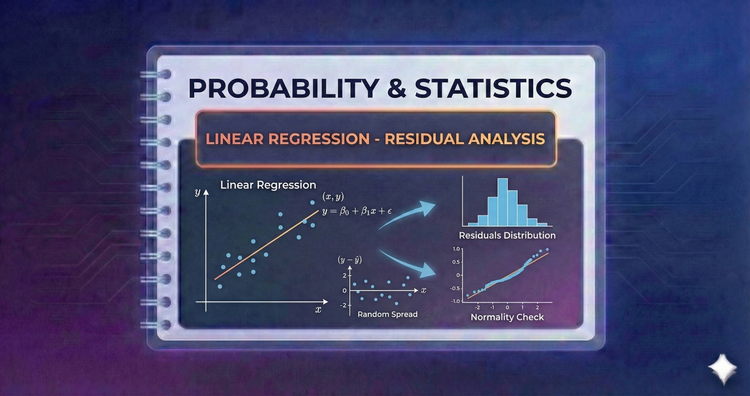
Probability & Statistics - Linear Regression - Residual Analysis
We diagnose models by examining residuals—the difference between observed and predicted values. A random cloud of points in a residual plot indicates a healthy model; specific patterns suggest we are missing a key variable or relationship.