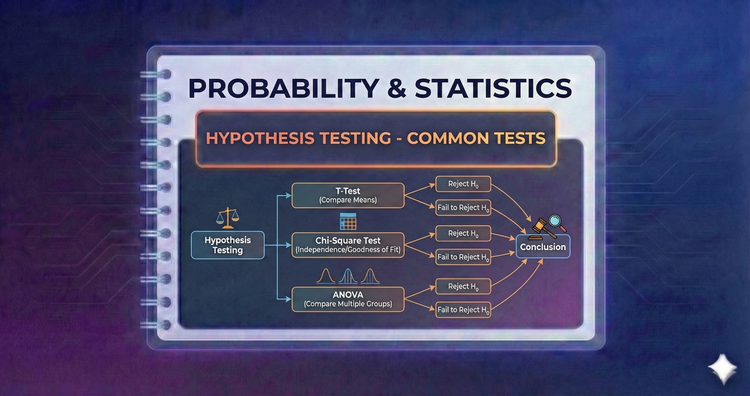
Probability & Statistics - Hypothesis Testing - Common Tests
We survey the toolkit: One-sample t-tests for benchmarks, Two-sample
t-tests for comparing groups (A/B testing), and Paired tests for before-after data. Selecting the correct test is crucial for valid conclusions.
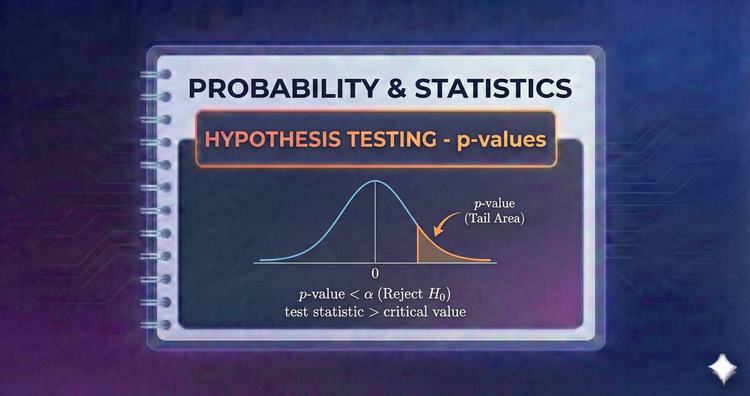
Probability & Statistics - Hypothesis Testing - p-values
The p-value measures evidence against H0. It is the probability of observing data this extreme assuming H0 is true. A low p-value (e.g., < 0.05) signals that the observed result is unlikely to be a fluke, suggesting H0 is false.
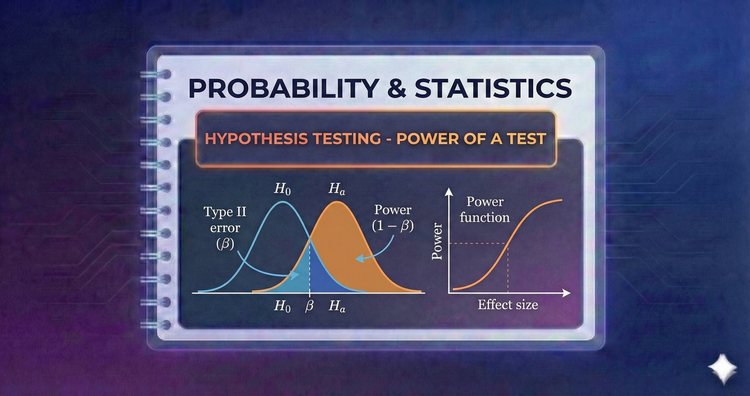
Probability & Statistics - Hypothesis Testing - Power of a Test
Power is the ability of a test to detect a real effect. A powerful test rarely misses a discovery. We boost power by increasing sample size or reducing noise, ensuring our study is sensitive enough to find what we are looking for.
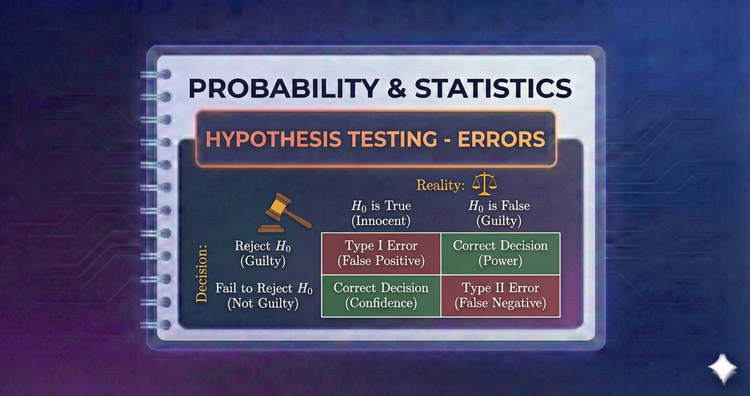
Probability & Statistics - Hypothesis Testing - Errors
Decisions carry risk. A Type I Error is a False Positive (rejecting a true H0). A Type II Error is a False Negative (missing a real effect). We design tests to minimize these risks, balancing the cost of a false alarm against a missed discovery.
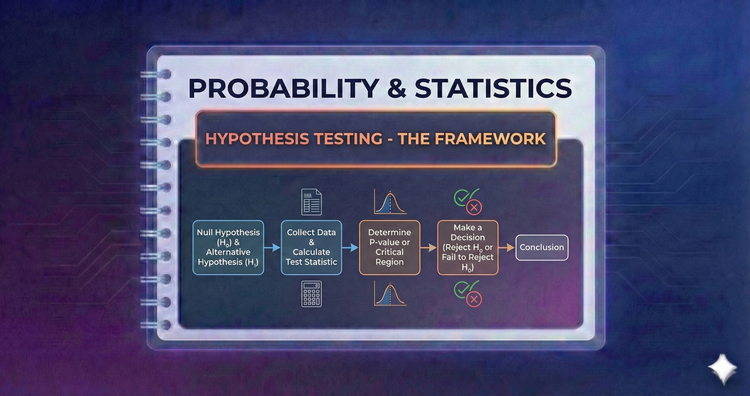
Probability & Statistics - Hypothesis Testing - The Framework
The scientific method in math form. We pit a Null Hypothesis (H0, status quo) against an Alternative (H1, the discovery). We assume H0 is true and only reject it if the data provides overwhelming evidence to the contrary.
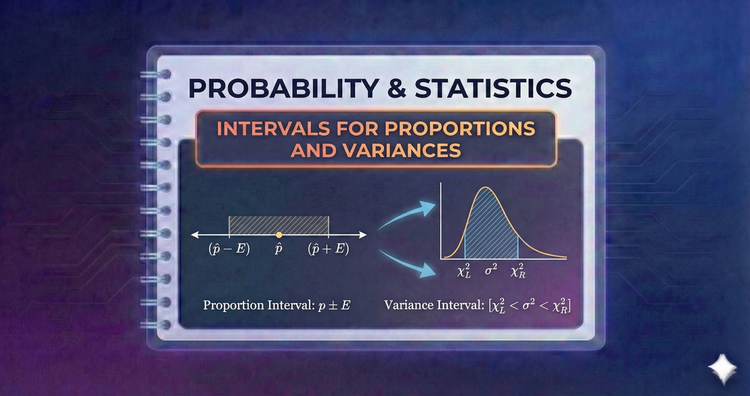
Probability & Statistics - Intervals for Proportions and Variances
We extend intervals to proportions (for polling data) and variances (for quality control). Using Normal approximations for proportions and Chi-Square for variances, we can bound the likely percentage of voters or the consistency of a machine.
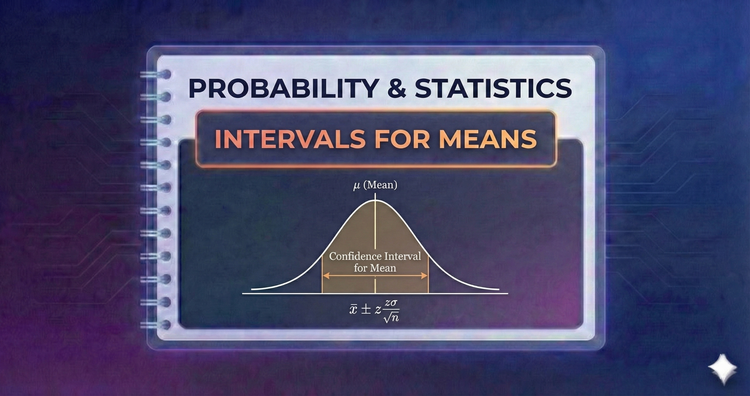
Probability & Statistics - Intervals for Means
We build intervals for the mean using Z-scores or t-scores. This distinction is vital: using the t-distribution accounts for the extra uncertainty in small samples, ensuring our bounds remain accurate.
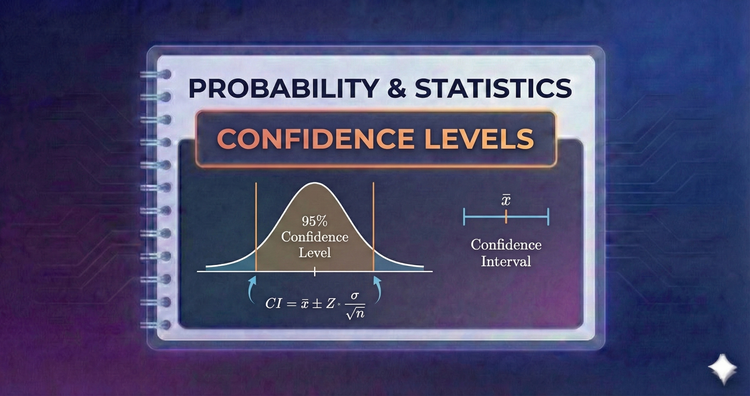
Probability & Statistics - Confidence Levels
What does "95% confident" mean? It refers to the method, not the specific interval. It implies that if we repeated the sampling 100 times, 95 of the resulting intervals would capture the true population parameter. It measures reliability.
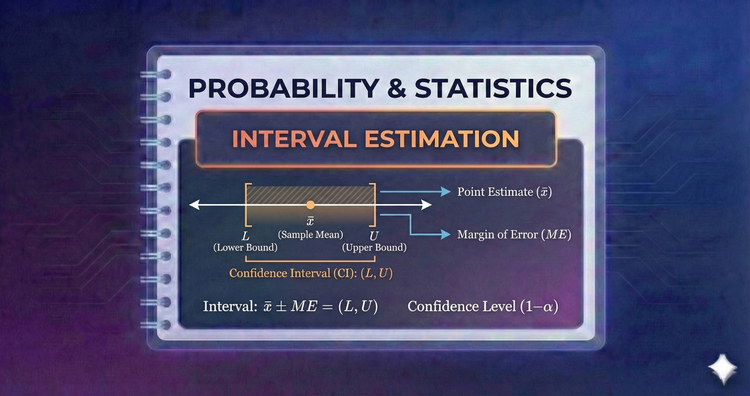
Probability & Statistics - Interval Estimation
Point estimates (single numbers) miss the full picture. Interval estimation calculates a range of plausible values for a parameter. This approach quantifies uncertainty, providing a "margin of error" rather than a false sense of precision.
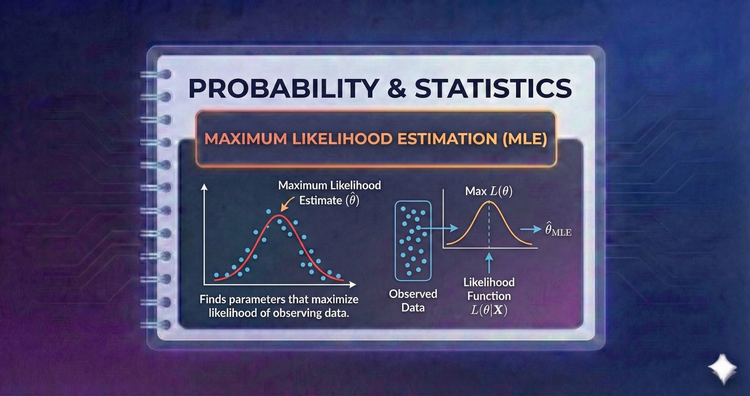
Probability & Statistics - Maximum Likelihood Estimation (MLE)
MLE asks: "Which parameters make our data most probable?" By maximizing the Likelihood Function, we derive estimators that are often the most accurate and precise, making MLE the gold standard for fitting models in modern statistics.